
Key Takeaways: Longest-Ever U.S. Government Shutdown Nears Its End
- The U.S. government shutdown began on October 1 and is now in its 41st day — the longest in U.S. history.
- The Senate’s bipartisan funding bill could be passed early this week, followed by a House vote by Wednesday.
- If President Trump signs the bill, agencies could begin reopening by Friday U.S. time (Saturday AEST).
- Economic data flow won’t normalise immediately — expect a two-to-three-week lag for major reports such as NFP, GDP, and CPI.
- Traders will focus on the first major data releases for clues on the Federal Reserve’s next move.
On October 1, the U.S. government began what has become its longest shutdown in history. As always, it didn’t come without warning, which helps explain why the market impact has been muted. That said, many had assumed it would reopen quickly — an assumption that’s now clearly been tested.
Since 1976, the U.S. government has shut down 22 times (including the current episode), with past closures ranging from one day to 35 days and averaging about eight days. If the Senate’s new funding bill passes and President Trump signs it in the coming days, this shutdown will have lasted at least 43 days, easily eclipsing the 35-day record from 2018–19.
The key question for traders now is when economic data will return.

View related analysis:
- Australian Dollar Outlook: RBA Hold Puts Focus on AU Jobs, US CPI
- EUR/AUD, EUR/NZD Outlook: Euro Dominates Commodity Currencies
- 153 Remains Pivotal For USD/JPY, AUD/USD Stabilises with Wall Street Bounce
- USD/JPY Outlook: Japanese Yen Dominates Amid Wall Street Selloff
When Could the U.S. Government Reopen?
The Senate has already advanced the funding bill, setting up a final vote. Assuming there are no last-minute amendments, the final Senate vote could take place late Monday or Tuesday (U.S. time).
If it passes with bipartisan support, the bill then heads to the House of Representatives. While the House is Republican-controlled, that doesn’t guarantee immediate passage — but the political pressure after a 40-day shutdown makes a swift vote likely. The House could pass it by Wednesday, clearing the way for the bill to reach the White House.
Once it lands on President Trump’s desk, he could sign it within hours, officially ending the shutdown. Federal agencies would then begin reopening the following business day — realistically by Friday U.S. time (Saturday AEST).
When Could Traders Expect Economic Data to Resume?
While a few high-priority data points — such as CPI — have trickled out through alternate sources or partial releases, most federal statistics remain on hold. Agencies including the Bureau of Labor Statistics (BLS), Census Bureau, and Bureau of Economic Analysis (BEA) have suspended normal data collection.
Once funding is restored, these agencies will need two to three weeks to restart operations, validate delayed inputs, and backfill major reports such as Nonfarm Payrolls, GDP, and JOLTS.
That means traders may not see a fully normalised U.S. data calendar until late November or early December — even if the government reopens this week. However, those data points will remain vulnerable to later revisions as agencies work through the backlog.
Still, after a six-week blackout, traders are likely to trade on whatever data they can get, even if it comes with caveats.

Which Economic Data Points Will Traders Priorities?
Traders will zero in on the big three: Nonfarm Payrolls, PCE inflation, and GDP. These are the cornerstone indicators that shape Federal Reserve expectations and drive volatility across currencies, bonds, and equities. With no fresh labour or inflation data for weeks, markets have been trading largely on sentiment and positioning — so the first full releases are likely to trigger outsized reactions. A stronger-than-expected payrolls rebound, for example, could quickly unwind Fed rate-cut bets that built up during the shutdown.
Beyond those headline prints, attention will shift to retail sales and JOLTS job openings to gauge underlying demand and wage pressure. But after a six-week data vacuum, traders will treat almost any high-impact release as a catalyst. Even typically second-tier reports like industrial production or housing starts could move markets more than usual until the economic calendar normalises.
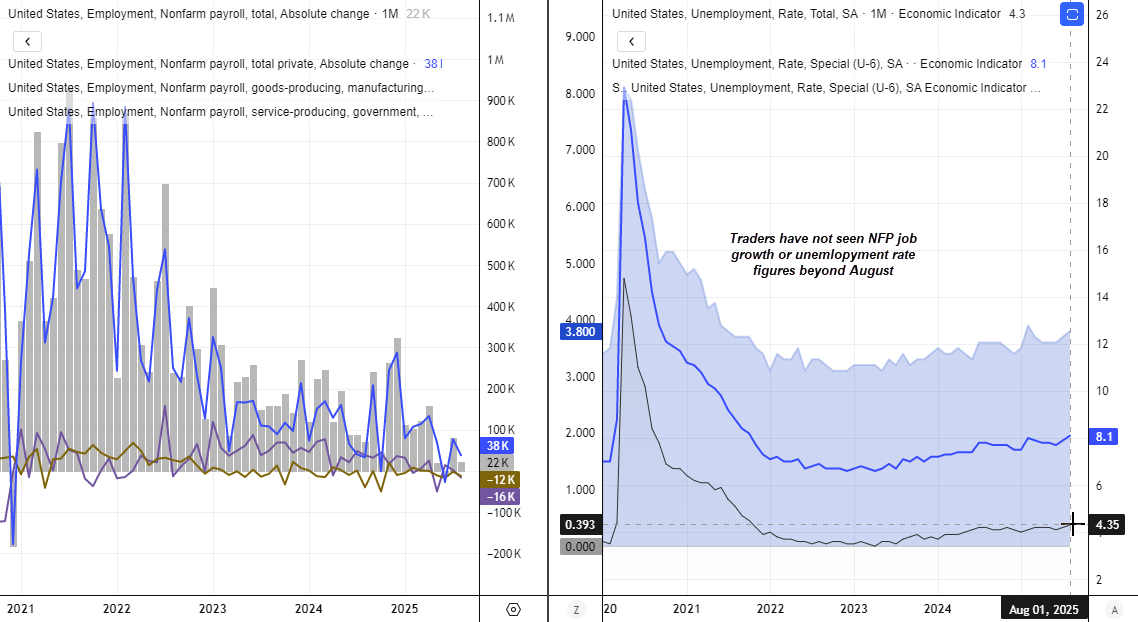
Chart prepared by Matt Simpson - data source:
Commitment of Traders (COT) Reports To Finally Return
A data set I’ve personally missed are the Commitment of Traders (COT) reports from the Commodity Futures Trading Commission (CFTC). Knowing the net long or short exposure helps traders monitor the strength of an underlying trend, identify divergences between price action and sentiment, and flag potential reversal zones when positioning reaches extremes.
The U.S. dollar index has climbed over the past six weeks during the COT data blackout, so it will be interesting to see whether net-short exposure has narrowed. If the upcoming data show that gross longs are rising, it could suggest there’s more to the dollar rally than just short covering.
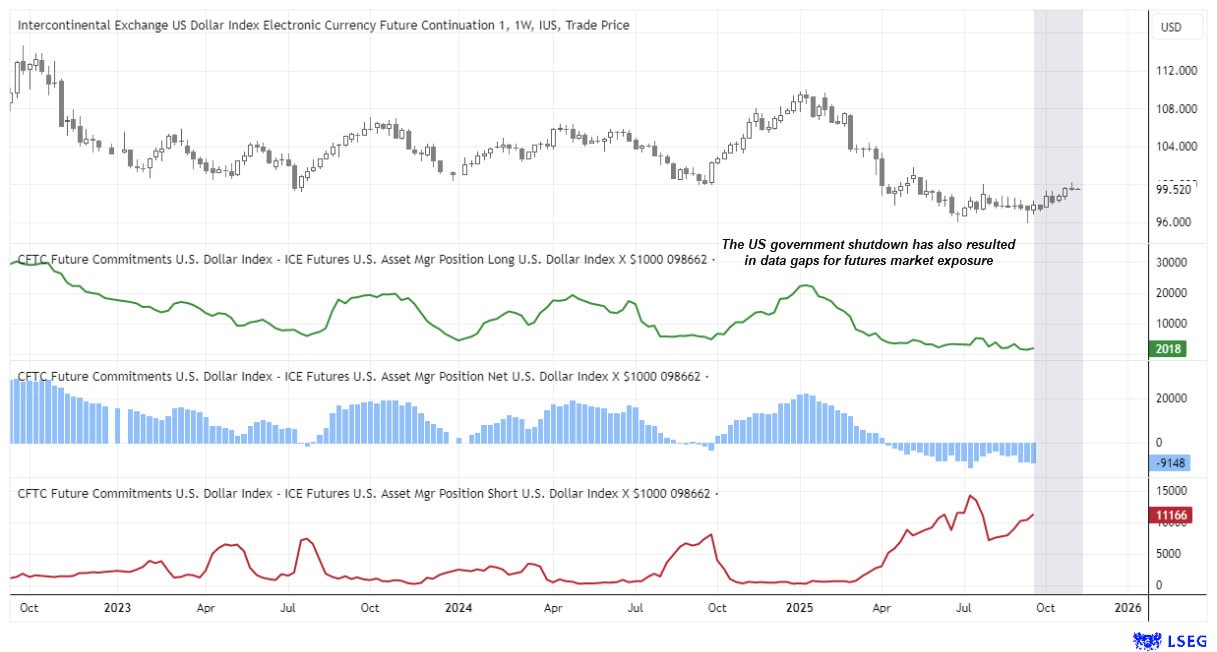
Chart prepared by Matt Simpson - data source: CFTC, LSEG
View the full economic calendar
-- Written by Matt Simpson
Follow Matt on Twitter @cLeverEdge
How to trade with City Index
You can trade with City Index by following these four easy steps:
- Open an account, or log in if you’re already a customer
• Open an account in the UK
• Open an account in Australia
• Open an account in Singapore
- Search for the market you want to trade in our award-winning platform
- Choose your position and size, and your stop and limit levels
- Place the trade